
Inhibition of the Dissolution of Calcium Carbonate Filler



RESULTS
Surface Analysis
XPS
| Atomic composition (%) |
untreated GCC
|
treated GCC
|
| Carbon |
21.
|
18.4
|
| Oxygen |
58.0
|
57.6
|
| Calcium |
10.9
|
12.0
|
| Aluminium |
4.1
|
3.5
|
| Silicon |
5.3
|
4.3
|
| Phosphorus |
--
|
4.1
|
 The
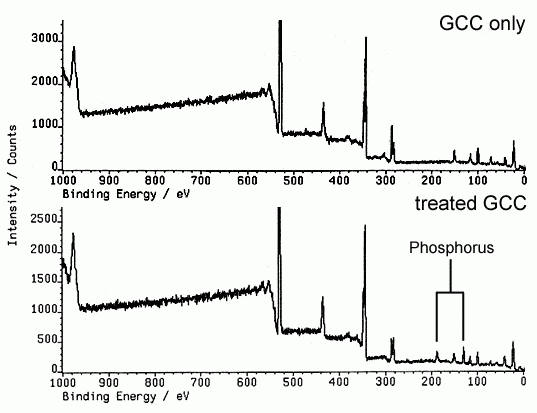
XPS survey spectra of GGG and GCC treated with H3PO4 are shown in Figure
3. The atomic composition (in atomic %) calculated from the spectra using
the software provided with the instrument is tabulated below. The presence
of Al and Si oserved in both spectra were due to impurities such as clay present
in the sample. XPS analysis clearly confirmed that the presence of phosphorus
only on the surface of the treated GCC.
The
XPS survey spectra of GGG and GCC treated with H3PO4 are shown in Figure
3. The atomic composition (in atomic %) calculated from the spectra using
the software provided with the instrument is tabulated below. The presence
of Al and Si oserved in both spectra were due to impurities such as clay present
in the sample. XPS analysis clearly confirmed that the presence of phosphorus
only on the surface of the treated GCC.
TEM
 Figure
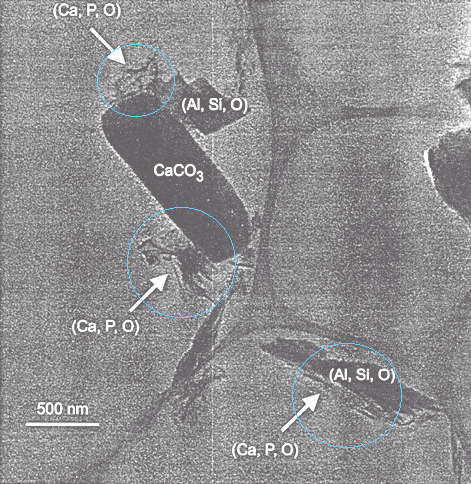
4 shows the TEM scan of GCC treated with H3PO4. Thin, sheet-like solid
fragments were found to attach to both GCC and clay particles (impurities)
but did not seem to fully cover the particles surfaces. Only a few isolated
fragments were found whihch indicated
Figure
4 shows the TEM scan of GCC treated with H3PO4. Thin, sheet-like solid
fragments were found to attach to both GCC and clay particles (impurities)
but did not seem to fully cover the particles surfaces. Only a few isolated
fragments were found whihch indicated 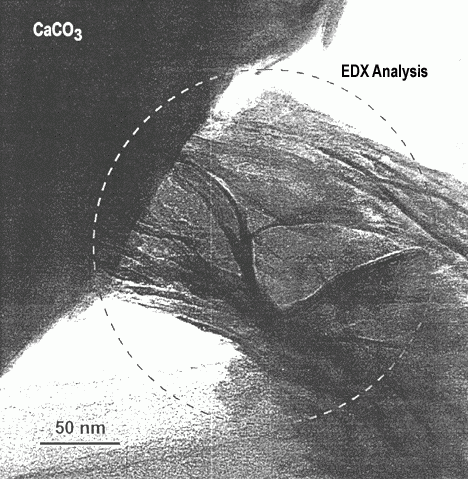 that
the Ca-P precipitates were mostly formed on the GCC particles. Figure
5 shows the fragments at a higher magnification.
that
the Ca-P precipitates were mostly formed on the GCC particles. Figure
5 shows the fragments at a higher magnification.
EDX
 Figure
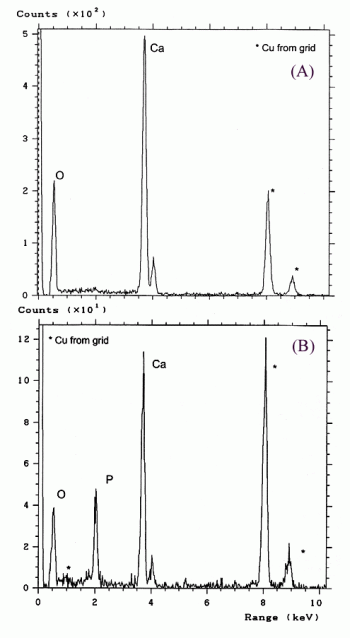
6 compares the EDX spectra of the fragments (obtained from the area highlighted
by a dotted line circle on Figure 5) with that of untreated GCC. Clearly,
it can be confirmed that the fragments composed of Ca, P and O.
Figure
6 compares the EDX spectra of the fragments (obtained from the area highlighted
by a dotted line circle on Figure 5) with that of untreated GCC. Clearly,
it can be confirmed that the fragments composed of Ca, P and O.
XRD
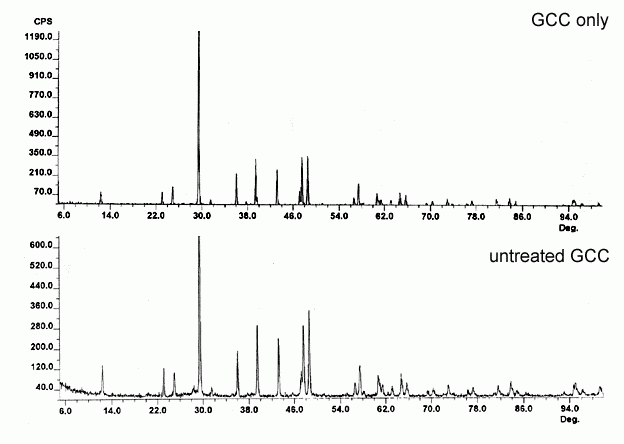 X-ray
powder diffraction traces for GCC and treated GCC are given in Figure
7. The upper plot shows a characteristic pattern of GCC with intensities
at d-spacings corresponding to 0.303, 0.190 and 0.187 nm. The trace for treated
GCC did not show any differences from the pure chalk with now new peaks detected.
Hence if new solids were precipitated because of the treatment, they were
not crystalline as XRD did not detect them. However, it is possible that this
precipitated coating was too thin in thickness ( in very small amount) to
give a different diffraction pattern.
X-ray
powder diffraction traces for GCC and treated GCC are given in Figure
7. The upper plot shows a characteristic pattern of GCC with intensities
at d-spacings corresponding to 0.303, 0.190 and 0.187 nm. The trace for treated
GCC did not show any differences from the pure chalk with now new peaks detected.
Hence if new solids were precipitated because of the treatment, they were
not crystalline as XRD did not detect them. However, it is possible that this
precipitated coating was too thin in thickness ( in very small amount) to
give a different diffraction pattern.